Memory Price Data for Journalists and Researchers
MemRadar tracks retail prices for 235 consumer RAM and SSD products, with recorded history reaching back to 2015 on the longest-tracked parts. The data is free to cite with attribution, and custom cuts are available on request at no cost. This page exists so you can decide quickly whether it is useful for a story.
Contact: hello@memradar.com.
What the data covers
| Segment | Products | Median tracked days | Earliest first tracked |
|---|---|---|---|
| DDR5 | 84 | 254 | October 30, 2021 |
| DDR4 | 35 | 267 | November 12, 2015 |
| NVMe SSD | 82 | 277 | November 27, 2016 |
| SATA SSD | 34 | 319 | January 23, 2018 |
Tracked days counts distinct days on which a price was recorded for that product, so a median of 200 means a typical product in that segment carries roughly 200 recorded days of history.
Prices are retail prices in the United States, in US dollars. Price history for Amazon.com listings is licensed from Keepa, and every finding, file and Price Index figure on this page is computed from it. The index prefers Amazon's own offer when available. When Amazon is not the seller, a new-condition marketplace price on the same Amazon.com listing can be used. Newegg prices, from the retailer's catalog feed via Rakuten Advertising, are current prices only: they appear on product pages as a comparison and are never part of the Price Index or of any history, finding or file here. This is a different series from the contract and spot prices quoted in industry reporting, and it follows those with a lag of weeks.
The segment trends are also published as JSON for software to read, regenerated daily and carrying the date it was computed.
The monthly series is available as a CSV download, giving the median price, the median price per gigabyte and the product count for each segment and month; read the notes at the top of the file before computing any change from it.
A second file, the build-cost CSV, gives the monthly total for a fixed basket of parts (a memory kit and the drives beside it) with each component median and its product count. The Build-Cost Index explains the baskets and what the figures do not tell you. The same warning applies: these are price levels, not a measure of change.
Both are free to use with attribution to MemRadar. The JSON path carries its version, so this file keeps its shape and any change to it would ship as a new version alongside; both files are regenerated daily and state the date their figures were computed. Per-product price history is not available for third-party use.
Amazon prices are scheduled for collection up to six times a day; between September 24 and October 6, 2026, we averaged about four successful fetches a day. The full definitions, calculations, and limitations are on the methodology page, including what this data cannot tell you. That page is worth a skim before citing a figure.
Current findings
The segment findings below use the live one-year reading: each segment's median price now against its median a year earlier, over the products tracked at both points, recomputed daily. That is a different statistic from the Price Index's monthly record, which compares each listing with itself and is frozen once computed, so the two year-over-year figures differ; cite the record for year over year. Each finding is stated as a magnitude rather than to a decimal place, because comparisons over longer windows rest on smaller product sets and can shift as the catalog changes. The live figures behind them are in the table on the methodology page.
- On the live one-year reading, the median DDR5 memory kit has more than doubled over the past year. Computed November 1, 2026.
- On the live one-year reading, NVMe and SATA solid state drives have both more than doubled. Computed November 1, 2026.
- 211 of the 235 products MemRadar tracks, 90%, currently sell for at least one and a half times their lowest recorded price. Computed November 1, 2026.
- 157 of the 235 tracked products sell for more than three times their lowest recorded price. Computed November 1, 2026.
How to cite
For the year-over-year figure, cite the Price Index's latest frozen monthly record, MemRadar Memory Price Index, October 2026:
MemRadar. "Memory Price Index, October 2026 record." Frozen November 1, 2026. https://memradar.com/price-index/2026-10/
The record's segment figures are also published as JSON. For the findings above, which use the live reading and are recomputed:
Source: MemRadar Memory Price Index, live market reading computed November 1, 2026, memradar.com/price-index/
Please include the date the figure was computed, which appears on every page carrying data. Figures change daily, with one exception: the Price Index's monthly record is frozen and carries the date it was frozen: for months after the launch series, after the month ends, once a price fetch past the month boundary has landed; the launch series from October 2024 to September 2026 was reconstructed from stored history and frozen on October 12, 2026. Cite the frozen date, and the record's own page, for the year-over-year figure. Each record page, from September 2026 onward, lists every paired listing and offers a JSON download of the segment figures.
Two series on this page describe memory prices differently, and they will not reconcile. The monthly CSV is the median of each month's readings across whatever products were tracked that month; the Price Index record compares each product with itself a year earlier and takes the median of those changes. The CSV also cannot reproduce the record: before July 22, 2026 the stored history records a price only when it changed, so the record is computed from a carried-forward daily series under the rule described in the methodology, not from raw readings.
You are welcome to reproduce charts and tables from this site with attribution. If you need a higher-resolution version of a chart, ask.
Charts to download
Five charts of the monthly series, free to publish with attribution. Each is 1200 by 675 pixels and carries its source and the month its data runs through inside the image, so the credit survives if a caption is dropped.
Embed the dated file, not the latest one. A dated file never changes once published. The latest file is replaced each month when a new month of data completes, so an article embedding it would find its chart changing under text written about the old one. Earlier months stay at their own addresses.
- DDR5 memory: median price per GB, data through October 2026. Always the newest month: ddr5-latest.png
- DDR4 memory: median price per GB, data through October 2026. Always the newest month: ddr4-latest.png
- NVMe SSDs: median price per drive, data through October 2026. Always the newest month: nvme-latest.png
- SATA SSDs: median price per drive, data through October 2026. Always the newest month: sata-latest.png
- DDR4 and DDR5 memory: median price per GB, data through October 2026. Always the newest month: ddr4-ddr5-latest.png
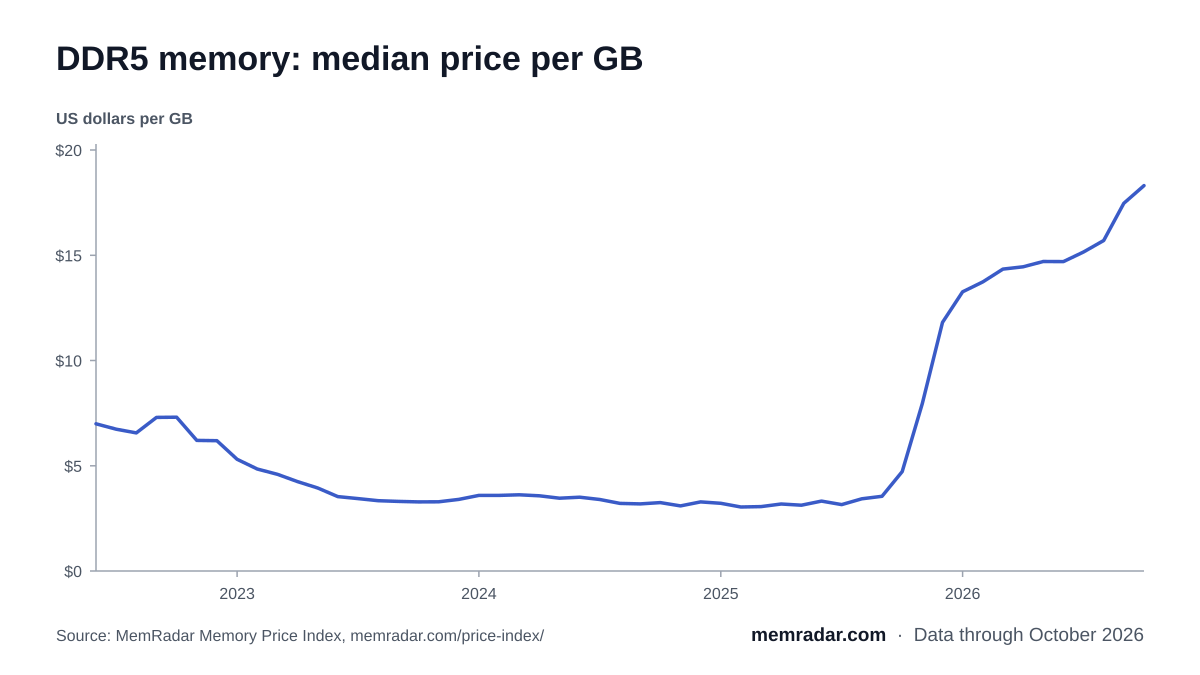
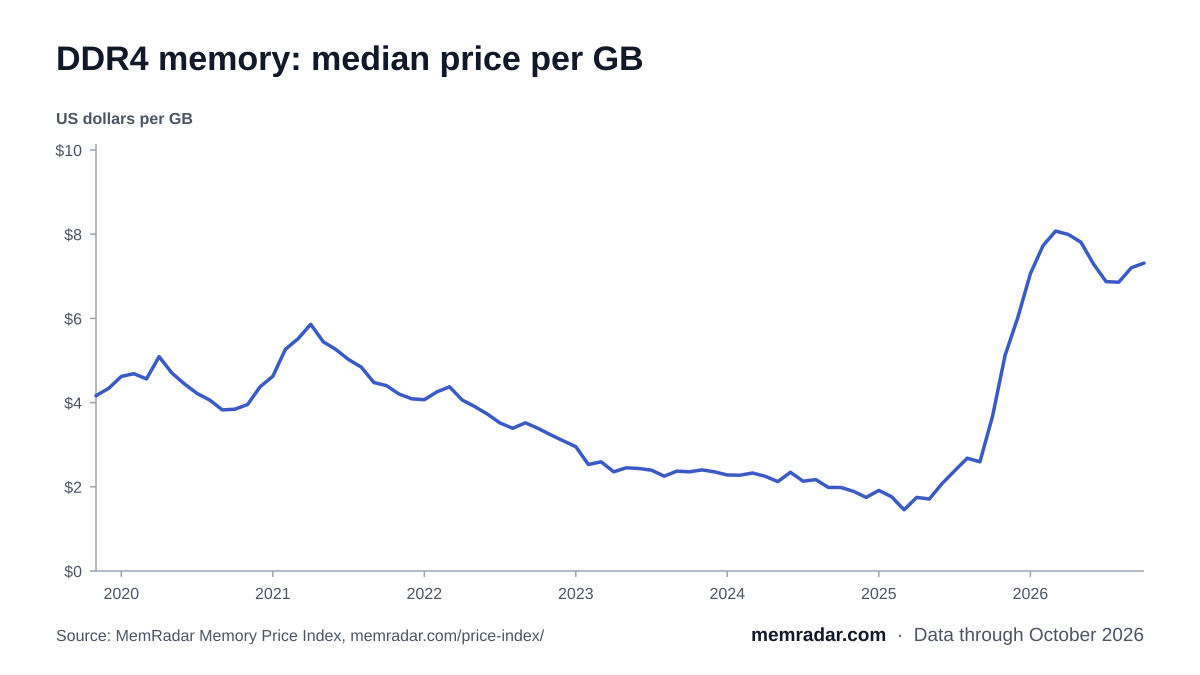
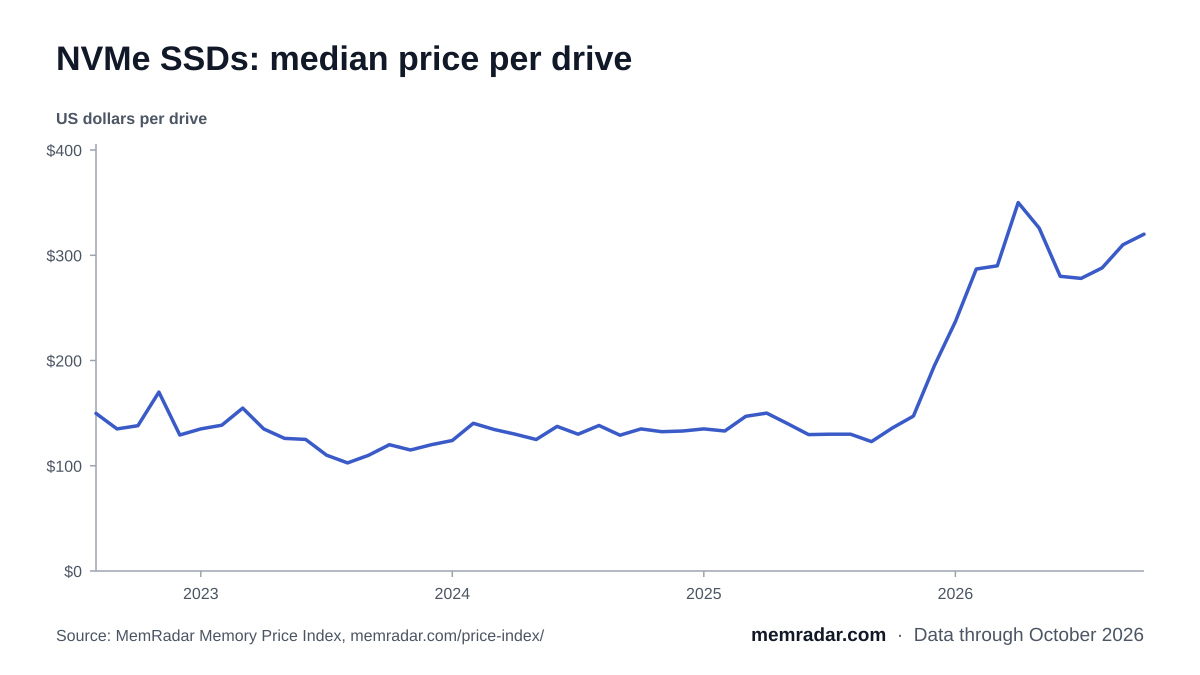
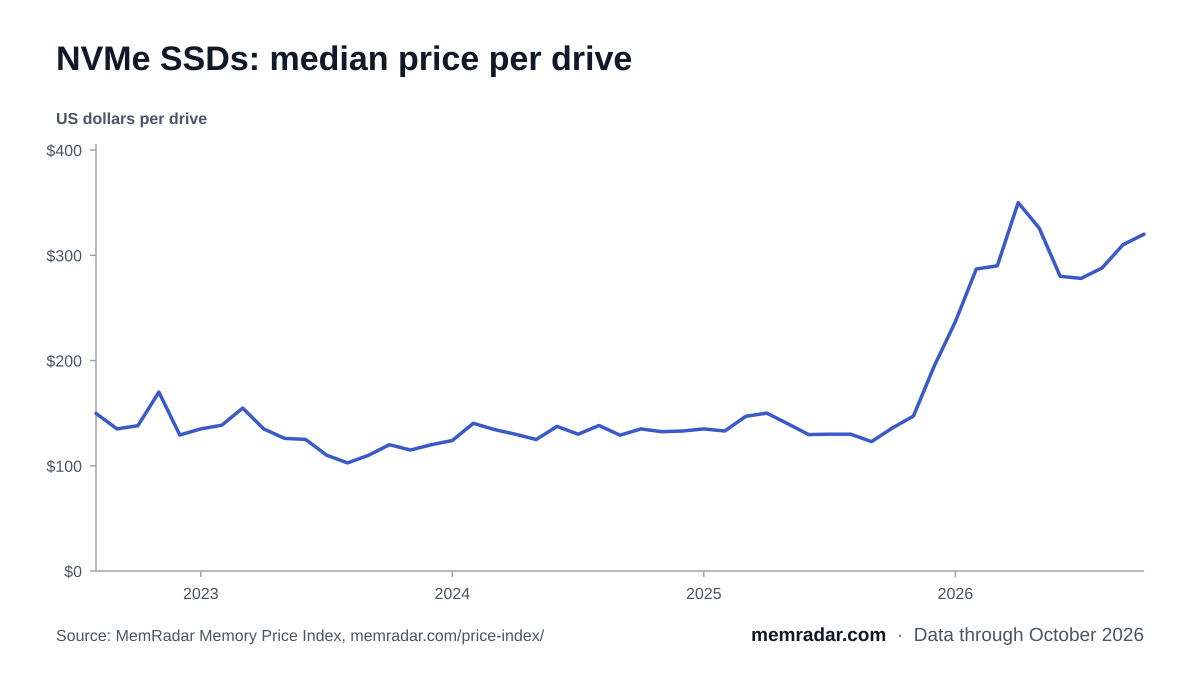
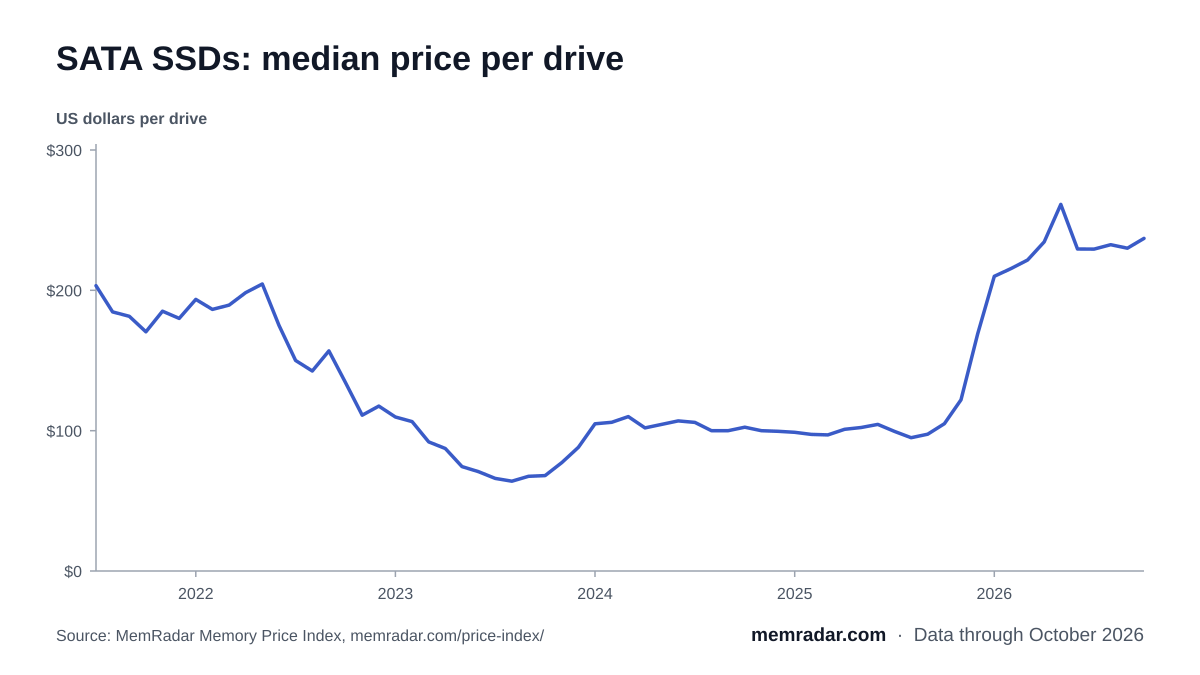
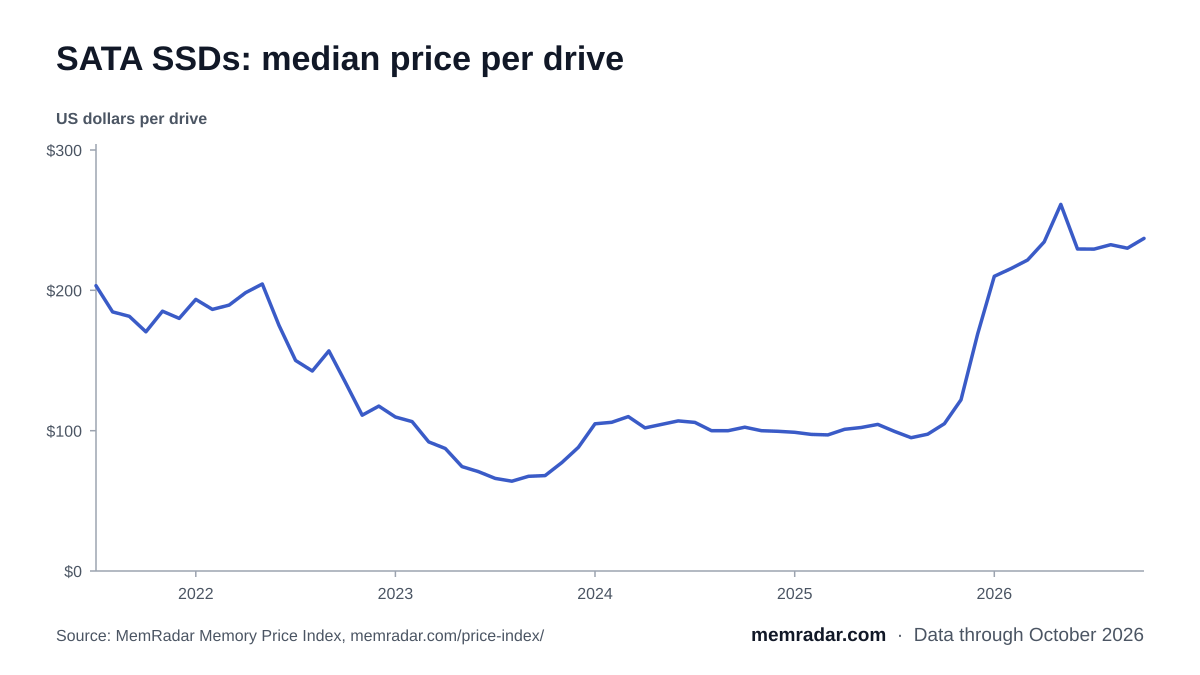
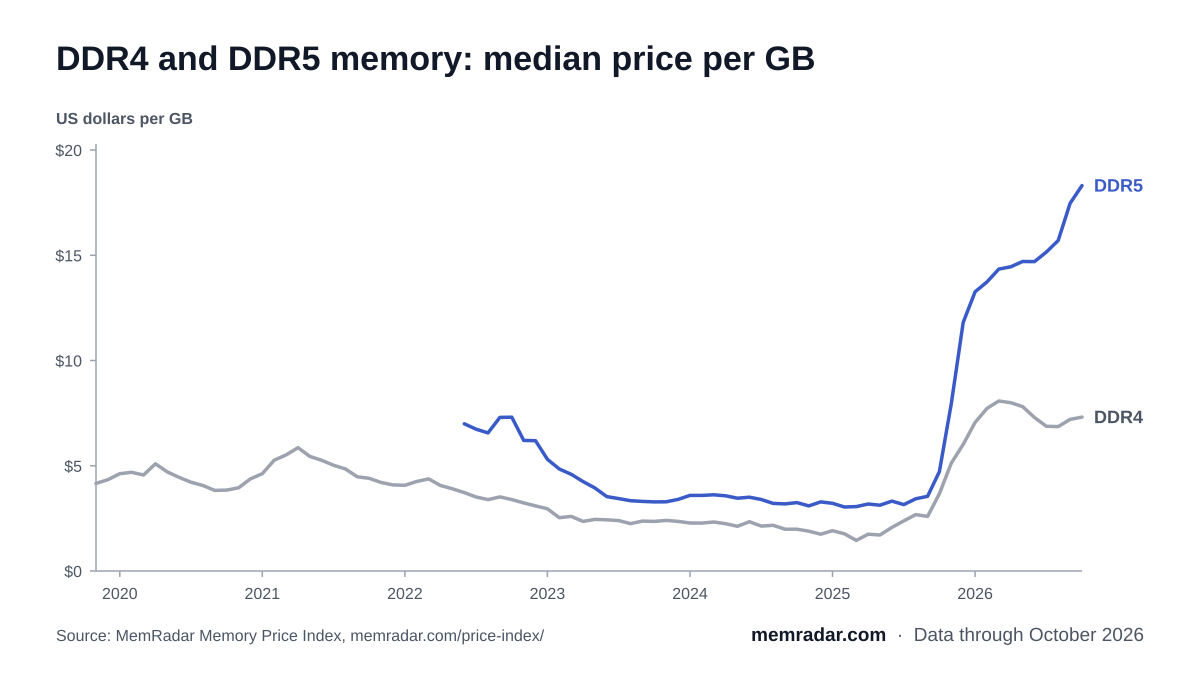
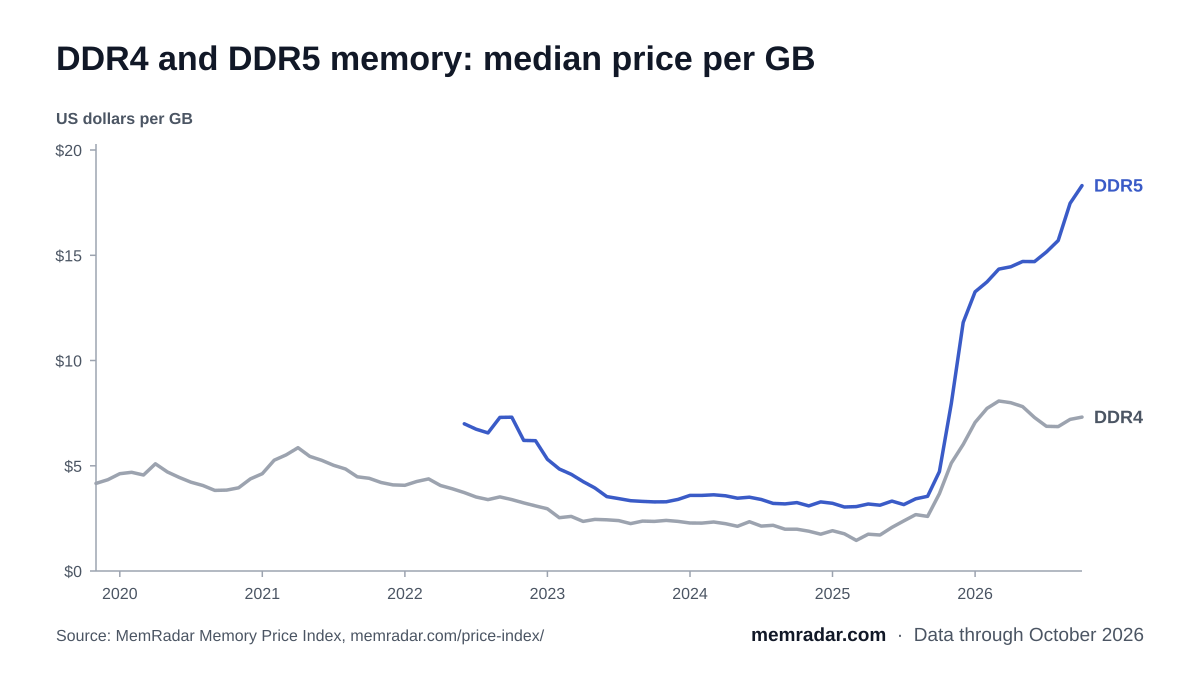
Memory is charted per gigabyte because the typical kit size shifts from month to month. SSDs are charted per drive because their price per gigabyte moves with the mix of drive sizes. These are price levels: for how much prices changed over a period, cite the price index, which compares each product with itself.
Custom data requests
Most of what is useful for a story is not on the site. If you tell us what you are writing about, we can usually produce it the same day at no cost. Examples of what has been asked for or is readily available:
- A segment's median price by month over any period we cover.
- The price history of a specific product, as a series rather than a chart.
- Which tracked products are furthest from, or closest to, their all-time lows.
- A comparison of two segments over a matched window, using the same fairness rule the index applies.
- The distribution of current prices against all-time lows across the catalog.
We do not charge for this and do not ask for anything in return beyond attribution. Write to hello@memradar.com with the question you are trying to answer and a deadline if you have one.
What we can and cannot speak to
Worth stating plainly so you know whether to call.
We can speak to: what consumer retail prices have actually done over the period we cover, how specific products and segments have moved, how current prices compare with their own history, and how our figures are calculated.
We cannot speak to: contract or spot pricing, manufacturer production decisions, supply forecasts, or anything about the memory industry's internals. Those are TrendForce's and the manufacturers' territory, and we would be guessing.
We are a single-person project with a licensed data source, not a research firm. That is worth knowing before you describe us in print.
About the source
MemRadar is an independent price tracker built and run by Malcolm Konner. It is funded by affiliate commissions from retailer links, disclosed on every page that carries them, and those commissions do not influence prices, rankings, or the figures published here. The full disclosure is on the affiliate disclosure page.
The site's data and methodology are public because a number nobody can check is a number nobody should print.
Findings on this page update automatically from tracked prices; the Price Index's monthly records do not change once frozen. Page last regenerated: November 1, 2026.